Chapter 1 - Not just levelling out Property Tax - Lowering It
In most cases, where key numbers are used, I have provided links to the City of Kamloops documents used to calculate those numbers. In some cases I have also provided spreadsheets.
---------------------------------
Every time an election comes around, every time a public housing project or beautification project is announced, every time a government of some kind makes some kind of investment in something - you can anticipate a waterfall of comments on Social Media of two varieties "how about fixing the potholes" or "how about feeding the hungry". In this hyperbole, the waterfall of comments is as predictable as the gravity that pulls that water to the ground.
Political rhetoric is surrounded by a two-sided, binary, coin of social progressives insisting that paying high taxes is worth it to be a moral, just, fair human of good conscience. Meanwhile, folks who value personal liberty and freedom, and see caring as a personal act, not one for the government to force down their throats battle against, in their view, social programs that unfairly redistribute their income to those not deserving of it. "Bleeding Hearts" calls the one side, while the other volleys "evil Capitalists".
I know a lot of people from both sides of the that coin - and I would describe neither of them in the absolute and polarizing descriptions tossed around on social media. While I could spiral down a philosophical analysis of all the complexity, misguided assumptions and self-defeating aspects of both rhetoric, what I would instead like to suggest is, we can achieve the socially progressive goals, we can achieve the fixing of the potholes, we can beautify our City...... and we can lower taxes. I would like to argue that there is a third option in this binary rhetoric.
That is because there is a very important missing element of this argument - which is the system of development in which we live, how it is managed and regulated, and how that influences the cost of delivering service and how valuable the thing we are taxing is. I am going to be really basic before building this up into the grand unified theory of lower property tax, better social programs, and fixing the potholes.
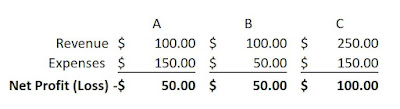
This is a profit and loss sheet, also known as an income or operating statement, for the most basic of organization. We need to accept that a bottom line of $0 over time is required and non-negotiable.
What you can see is in scenario A, the organization brings in $100, spends $150 and has a loss of $50. We can improve that loss to a profit position in one of two ways. Reduce the expenses to $50, like in Scenario B, or increase the Revenue like in Scenario C. When people look at government, Social Progressives generally like Scenario C - increase taxes to increase revenue so that we don't have to change the expenses (social programs specifically) - companies and individuals can get by on less for the 'greater good'. Financial Conservatives generally like Scenario B - don't increase my taxes, the government should just find ways to get by with less.
This takes us to the next step, where government finds its Revenue;

You can see here, that if the tax rate is 4% - and the value of the thing being taxed; income, a sale, a property, a company, a paycheque - then the amount of Revenue collected by the government is $4000. If you increase the value of the thing taxed, or increase the rate on the amount collected - you can increase government Revenue. Generally Social Progressives want to increase the rate of the tax, and Capitalists want to increase the Value of what is taxed.
Now lets look at expenses. Expenses specific to Municipal Government. City Expenses include roads, storm-water, sewage, potable water delivery, fire and police, parks and rec, enforcement of building code, and in an indirect way, electricity and natural gas delivery. Most of these expenses intensity is primarily a function of distance and area. Pipes, roads, electrical delivery, gas delivery, shipping, snow plowing, street cleaning - cost more by distance than by size. To illustrate this lets look at 12" of pipe from a hardware store in 1/2" diameter and 3/4" diameter.

Adding a 25% increase in the size of the pipe, from 1/2" to 3/4" increases the cost of the pipe by 14.8%. If you wanted to increase the length of the pipe by 25% you increase the cost of that pipe by 20.0% instead. You can apply this model to everything from electrical cable, to asphalt for streets, to street lights, to culverts. The math remains the same, and in some cases much more exaggerated than this. Increasing capacity is cheaper than increasing the length.
So in the Revenue and Expense Statement of the City of Kamloops, specifically the elements that are under its direct control, you get the follow categories;

So if we have to achieve Revenues that exceed Expenses, in my mind, we should be comparing the performance of the things we invest in as a City with what they return to us. When we spend money as a City, does that investment bring us back value on the Revenue side? When the City invests in Parks, it is investing in making Kamloops a desirable place to live, so people will want to compete to live here presumably because the parks are so great.
To examine this, lets look at an example from my 2012 book Stronger Kamloops. Arnica Street is a perfect example of a modern single family Cul-de-Sac. I picked Arnica Street for a few reasons.
1. It is in a 'well-off' neighbourhood. One could have trouble criticizing my choice based on 'low-value' properties. Few could say this is a neglected or undesirable area of town.
2. It is a dead-end; only the people who live on this street get any benefit from this street existing. One could never use this street as a primary route to somewhere, or even a detour if there was a blockage somewhere else. No one comes to this street to shop, work or recreate.
3. It is 'new'. Pineview developed in earnest in the mid 2000's, so in 2012 these were nearly all 'new' homes. There is little to no possibility that any of these homes are going to be torn down and replaced with an apartment building worth 50x there value - and of course that would be illegal by zoning in any case.
Arnica Street as 24 lots. Each is a single family home. Added up together they had an average Taxable Value in 2012 of $404,167 making the block worth $9,700,000. Assuming all these houses are paying full taxes (all are rentals - not qualifying for the owner-occupied grant / and no one is a senior - not qualifying for the seniors grant) the absolute most that the City collected from these properties in 2012 at the then tax rate of 4.37%/1000 (0.00437%) is $42,389. In that budget year, the city set aside 6.89% of the Budget for Infrastructure Maintenance. So that street essentially put $2920 combined into a 'savings account' to pay for the maintenance of the infrastructure on that street.

Consider when the asphalt on Arnica needs to be maintained in order to avoid potholes. In 2012, the cost of Hot-In-Place repavement, which is the current cheapest way to repave a street, cost $54,000 per 12' lane per KM. Provincial standards suggest that road re-pavement should be done every 9-11 years in order to avoid more expensive and difficult maintenance that happens when things are left to deteriorate for longer. Arinca Street would conservatively cost $45,684 to repave it when it is supposed to be repaved after roughly 10 years. In summary;

In 10 years, Arnica Street is $16,484 short of paying to repave its road - never mind the sidewalk, street lights... Controlling for distance, that is a loss of $58,452 per KM.
Of course we can just look at the cities 1970s/80s suburbs in Sahali, Brock and Westsyde to see that somehow re-paving these streets in their 9-11 year recommended time period didn't happen. The potholes, as social media will remind us, are everywhere. We can also look at projects, like the repaving of the 380m of Comox Avenue on the North Shore, that was repaved in 2017 for $1.2million - cost $1,578,947/lane/KM to know that no longer are we getting away with $54,000/lane/KM either. Or how about Oak Road, at a cost of $350,000 for 282m of road - $620,567/lane/KM.
Returning to the tax shortfall - based on $54,000/lane/KM according to government 'guides', not the numbers that we seem to actually pay - A couple examples from different area of Kamloops like Kyle Drive in Westsyde - $66,300 per KM shortfall - or Gordonhorn Crescent in Sahali - $44,257 per KM shortfall. The average I have calculated based on a random assortment of suburban streets in all neighborhoods in 2012 was $56,336/KM. The City of Kamloops at that time maintained 1520 KM - an estimated Net Loss on Expenses compared to Revenue each year of $8.6million per year.
That Net Loss is based on $54,000 per/KM. If we base it on the real numbers the City spent on Comox and Oak, at nearer to $1,000,000/km....
I mean I must have done the math wrong! Whats going on here? The thing is, all of the infrstructure I am talking about is all less than 70 years old. Most of it less than 30. We have not seen this bill because we simply have not paid the bill yet, we are just letting the potholes get bigger, and the pipes deteriorate further.
A final example of how costs rise when we don't do regular maintenance - If we wait as long as we did with the Victoria Street West Project, and let the infrastructure wear and tear until it needs really significant work to update, based on Vic West, which cost $13mil for 891m of street. Comparing apples to apples, that is $14.6mil/KM.
Admittedly my tax shortfall per street model is a little abstract. So lets think about Victoria Street Wests rehabilitation and the Cities actual total tax revenue, including all major tax payers like Domtar and New Gold, paying 14 times higher tax than you and your home - the bill to completely rehabilitate all the cities streets, which we know WILL have to happen at some point, would be $22,192,000,000.
Based on the cities total tax intake today of $110mil - and using the 2019 Finacial Plan budget of 27% to all municipal water/roads/drainage and maintenance - and assuming the city does not build a single new road or lane - our budget for maintenance will be $29,700,000 per year - meaning it will take us 747.2 years to pay to maintain the existing roads, pipes, street lights, storm sewers and water services we are currently delivering. If we stopped policing, stopped fire service, stopped all parks and rec funding, and devoted every tax dollar to paying for upkeep of our existing streets, sewers and water pipes, it will still take us 200 years to pay for the maintenance of what we have already built. What I am saying is, don't expect that pothole to be fixed anytime soon, possibly even in your lifetime.


All hope is not lost! In getting on to the good news, lets look at the tax value of the cities most valuable Commercial Developments in Sahali, that being Columbia Square and the Strip Malls around it;


The area bounded by Notre Dame, Summit and Columbia have 8 total titles. Of course there is lots of renters contained within these 8 titles, but if you want to buy one of these properties, there is 8 available one could buy. There is 65 total Business Licenses, and the total land area is 97,999 Sq. M. These properties have a combined Taxable Value of $81,169,000 - or $856/Sq. M. of land. Servicing these properties is 1,512 M of road, which as at 4-6 lanes with some complicated 8+lane intersections, you get, optimistically, a taxable value of $9,120 M of road. These numbers will become important soon.
I will insert one note here before continuing. With values mostly in the $4-$37million threshold, few if any of the landlords of these properties live in Kamloops. When the businesses in these malls pay their rent, their rent generally does not go to Kamloops based companies or Kamloops based landlords - that money goes out of Kamloops. This problem is much bigger than this, and will be the subject of a different article later.
Remember I said that not all hope is lost?
Lets looks at the 300 Block of Victoria Street, which is actually worth slightly less than the 200 and 400 blocks;


You can see that controlling for size, Victoria Street on the 300 block is worth $2447.22 per Sq. M. compared to Columbia Squares $856. For every serviced Sq. M. the City gets 2.9 times the tax out of Victoria Street compared to Columbia Square - and Columbia Square is the cities MOST SUCCESSFUL strip mall.
Compare;
1967 Trans Canada E, also known as the Valleyview Strip mall at Oriole Road - $600/Sq.M.
2121 Trans Canada E, also known as Valleyview Square containing Princess Auto - $521/Sq.M.
Sahali Center Mall after Value Village - $465/Sq. M. - before Value Village, $278/Sq. M.
Northhills Mall - $458/Sq. M.
Westsyde Mall - $353/Sq. M.
Safe to say, Downtown Commercial is outperforming Stripmalls - or at the very least, paying three to eight times the taxes as Stripmalls.
But if we are thinking back to the cities Income Statement - How Much Tax do we get vs. How Much Do We Spend On Infrastructure to Service IT?
As you will recall, Columbia Square has a taxable value of $9,120 M of road, using M of road as a good indicator of how much the infrastructure costs to service. Victoria Street on the other hand has a taxable value of $105,892 per M of Road. Cost Recovery from servicing Victoria Street is 6.8 times better than it is on Columbia. The key factor here, is that Victoria Street and other Downtown development pays for itself. Downtown, Mixed-Use, pedestrian oriented development, pays for itseld and more, it returns to the City $$ in its pocket for the investment.
Remember the Arnica Street Cul-de-Sac. Arnica Street can only be used by the people on Arnica Street, it contributes no further value to other people. Downtown, if Lansdowne Street is closed for some reason, Victoria Street can substitute. Victoria Street also hosts downtown civic events like Brewloops, Hot Nite in the City, the Santa Claus Parade, and all sorts of Civic events that Summit and Norte Dame simply cannot.
Consider how much Downtown there is in the same area as Columbia Square, how many homes, workplaces, leisure spaces and services;

\
If Columbia Square had the same diversity and density of Downtown, there would be 438 Business in Columbia Square instead of 65. Instead of paying tax on $81,169,000 - Columbia Square would pay tax on $239,825,186. The incredible thing... so called derelict, decrepit and decaying Tranquille Road has a taxable Value of $1678/Sq.M.!!!!
Think about that, Tranquille is worth more to the City than Columbia Square by roughly DOUBLE.
A final point. Think about all the roads in the burbs that have absolutely NO tax base serviced by them. Roads like Hugh Allen, Pacific Way, Bachelor Drive, Westsyde Road, Highland Road, sections of Columbia and Summit - which are all incredibly expensive geo-technical roads, which do not have a single adjoining tax payer, to get to roads like Arnica Street which do not even pay for themselves.

In summary, we have a three way Venn Diagram to consider;

If my other Bloggings and writings have anything to show, its how amazing living in a City with great transit and density and public spaces can be. If we want to live in the development style of Single Family homes in Kamloops the way that we have, we need to pay WAAAAAYYY more taxes. If we want lower taxes, we need way more density.
Basically, if you want to see lower taxes in our community, you need to support higher density. I am not saying YOU have to live in a highrise apartment, but I am saying we need to make it legal to build apartments in more than just 6% of the land area of the city. We have to have regulations that make it profitable to build the mixed-use, high lot coverage downtown buildings that make 200-500 Victoria so valuable which are now illegal to build due to modern zoning regulation. We have to remove the red tape that make any sort of infill investment a difficult strategy, while further sprawl is easy and cheap.
The 2004 Official Community Plan, suggests that we should have a minimum city wide density of 25 units per hectare. Currently, if we built on every lot to its maximum density, we can only build to a maximum density of 21 units per hectare. We ratified this goal again in 2010 and again in 2018, but the zoning still makes 25 units per hectare illegal on basically every City lot.
This is not just a Kamloops issue. This is a Kelowna issue. Penticoton, All of Canada and the United States. There is 195 countries in the World. 193 build in a financially sustainable, dense, fashion.
You can read more about that for example in my last Blog Post here; https://marketurbanismkamloops.blogspot.com/2019/12/my-letter-to-council-regarding.html
Or all of these topics more extensively in the book I wrote, Stronger Kamloops, for free, at https://issuu.com/mitchellforgie/docs/stronger_kamloops
A NOTE ON CALCULATIONS
The City of Kamloops does get revenue from other sources than taxes - as mentioned above. I do not included DCC (Development Cost Charges) in my calculations because they depend on constant growth, which is not a permanent condition.
I also do not include User Fees, as those fees are generated from the service the city is providing, and usually not in enough quantity to actually remove the city subsidy from the service.
In many cases, Financial documents provided by the City do not provide anything like budget breakdowns of specific projects. Broad numbers like $1.3million for Comox Ave are reported on 2017 and 2018 Annual Reports. They do not say what is included and not included. I acknowledge that in many cases the City does not simply repave roads at arbitrary times, but instead looks to tackle many projects at the same time for savings. I do not disagree with this approach, but I do not think it greatly alters the math. Maybe my 200 year replacement math becomes 300 years, or 100 years - but I think the fundamental equation of cost vs. benefit stays true.
TL:DR
ReplyDeleteThis comment has been removed by the author.
ReplyDeleteYour argument about increasing capacity being cheaper than increasing length makes good sense, but some of the math is wrong.
DeleteYou write: "Adding a 25% increase in the size of the pipe, from 1/2" to 3/4" increases the cost of the pipe by 14.8%."
Actually, 1/4" is half of 1/2", so going from 1/2" to 3/4" is a 50% increase, not a 25% increase. In a further twist, going from a 1/2" diameter to a 3/4" pipe diameter also magically more than doubles the capacity of the pipe (calculate the area of the circles).
Also, going up in price from $4.59 to 5.39 is a 17.4% increase, not a 14.8% increase.
I am also not sure why you say a 25% increase in length of pipe would cost only 20% more. If you pay per foot of pipe, 125 ft. will cost 25% more than 100 ft.
None of this changes your argument, but fixing these bits would make it more credible.
Anyways, minor quibbles on a blog that makes an important point: density saves taxpayers lots of money!